 Afrikaans
 Azərbaycan
 Bosanski
 Čeština
 Dansk
Dansk Deutsch
 English
 Español
 Filipino
 Français
 Hrvatski
 Indonesia
 Italiano
 Magyar
 Melayu
 Nederlands
 Norsk
Norsk Oʻzbek
 Polski
 Português
 Română
 Slovenčina
 Slovenščina
 Suomi
Suomi Svenska
 Tiếng Việt
 Türkçe
 Ελληνικά
 Беларуская
 Български
 Русский
 Српски
 Українська
 עברית
עברית اردو
اردو العربية
 پښتو
پښتو فارسی
فارسی አማርኛ
አማርኛ मराठी
मराठी বাংলা
বাংলা தமிழ்
தமிழ் ไทย
ไทย မြန်မာ
 한국어
한국어 中文
中文 日本語
日本語

Windowsတွင်းနည်းပြင်းရှင်းသတ်ပြုခြင်းသည် စနစ်လုပ်ဆောင်မှုအမြန်နှုန်းတိုးမြှင့်ရန်နှင့် မှားယွင်းချက်များကို မှန်ကန်စွာထောက်လှန်ရန်အတွက် အရေးပါဆုံးဖြစ်သည်။ ဒီဘလော့ဂ်မှောက်တွင် Event Viewer နှင့် Performance Monitor (စနစ်လုပ်ဆောင်မှုတိုင်းရင်းကိရိယာများ) ကို အသုံးပြု၍ Windowsနည်းပညာရှယ်ယွင်းသောပြဿနာများရင်ဆိုင်ရတဲ့ပုံစံများကို အသေးစိတ်လေ့လာပေးထားပါတယ်။ Event Viewerမှနောက်ခံသတင်းလက်စွဲများအား စနစ်အလှကုန်ချုပ်၍ ပြဿနာရှိနေသောအမှုအရာများကို သိရှိသွားနိုင်သည်။ Performance Monitorစနစ်ခွဲခြမ်းရေးအရာများအားလုံးမှတဆင့် စနစ်ကျန်းမာရေးအခြေအနေကိုလည်း သတ်မှတ်။ အပြင်အာတယ် ၊ ပုံမှန်စနစ်ကို ရောထောက်လှန်နိုင်တဲ့ လက်ချက်များ၊ အမြန်ဆုံးသိရှိနည်းများ၊ performance monitor ကိုလည်း ဘာကြောင့်အသုံးပြုသင့်သလဲဆိုတဲ့အကြောင်းတွေ ထည့်ဆွေးနွေးထားပါတယ်။ ဤလမ်းညွှန်တစ်ခုဖြင့် Windows စနစ်မှာနည်းပြင်းရှင်းသတ်ပြုခြင်းပိုမိုထိထူးအောင်လုပ်နိုင်ပြီး၊ စနစ်အမြန်နှုန်းတိုးတက်မှုကို သိသာစွာမြှင့်တင်နိုင်ပါ့မယ်။
Windowsတွင်နည်းပြင်းရှင်းသတ်ပြုခြင်းဆိုတာဘာလဲ?
Windowsတွင်နည်းပြင်းရှင်းသတ်ပြုခြင်းဆိုသည်မှာ စနစ်တွင်ဖြစ်ပွားသောခက်ခဲသောအမှားများနှင့် performance ပြဿနာများကို ဖော်ထုတ်ပြီး အမြဲတမ်းတည်တံဝေနိုင်သောဖြေရှင်းနည်းကို အသုံးပြုခြင်းဖြစ်သည်။ လူတိုင်းဘဲမဟုတ်ဘူး၊ နည်းပညာအတွေ့အကြုံကြီးနေသူများ၊ system adminများ၊ IT support ပညာရှင်များသာ အဲ့နည်းေတြကို သက်ဆိုင်စွာသုံးပြုနိုင်တယ်။
နည်းပြင်းရှင်းသတ်ပြုခြင်းသည် ဗေဒပေါင်းများစွာစနစ်မှတ်တမ်းများ၊ event logs/နေရာများ၊ performance data ကိုနားလည်ဖို့လိုတယ်။ ပေါ်ပေါ်လေး troubleshootingနည်းများထက် အလွန်အကျွံလေ့လာ၍ root cause ကိုဖော်ထုတ်ဘို့ကြိုးစားရသည်။
နည်းပြင်းရှင်းသတ်ပြုခြင်းအမိန့်ချက်များ
- ပြဿနာသတ်မှတ်ခြင်း: ဘယ်အချိန် ဘယ်အခြေအနေနဲ့ ဖြစ်လာသလဲဆိုတာ ညွှန်ပြရပါမယ်။
- Event Logခွဲခြမ်း: Event Viewer မှာ error/warning messageတွေကိုထုတ်သုံးခြင်း။
- Performance Monitorစနစ်: System resourceအသုံးပြုမှုကို monitorလုပ်တယ်။
- Registry Analysis: Registry Editorမှာ configurationမမှန်တာတွေကိုစစ်လို့ပြင်တယ်။
- Advanced Diagnostic Tools: Memory test, disk scan, network analysis toolsတွေဖြင့် hardware/softwareအမှားကိုရှာတယ်။
- Driver/Software update: Hardware driver, software versionတွေကို updateလုပ်ဖို့စစ်တယ်။
နည်းပြင်းရှင်းသတ်ပြုခြင်းသည် မရှိသေးတဲ့ပြဿနာကို ပိုမိုရှင်းလင်းတင်ပြနိုင်တယ်၊ နောက်ပိုင်းအကြောင်းဖန့်ကျော်မှု့အတွက်လည်း အတိတ်ပြဿနာတွေ detectလို့သင့်တယ်။ စနစ် performance ကို regular monitorလုပ်ရင် riskအများဆုံးလိုက်လံလို့ systemလေးများအမြန်နှုန်း၊ stabilityပိုလာတယ်။
Event Viewer အသုံးပြုရန်အရေးကြီးပုံ
Windowsတွင်နည်းပြင်းရှင်းသတ်ပြုနည်းတွင် Event Viewerသည်စနစ်အတွက်ရောင်တပွတလင်းတယ်။ Event Viewerသည် လည်ပတ်မှု system၏အလွှာနောက်ကျောက် log dataတွေကို displayလုပ်ပေးသည်၊ error/warning/information messageတွေကို စနစ်တပ်တွယ်ဖော်ပြပေးသည်။ နောက်ကြားနာပြီးတော့ system logတွေကိုကျစ်လစ်ခဲ့လျှင် event abnormalလေး detectလို့ သိုးတတ်တယ်။
Event Viewerသည် hardware/software/system components တွေအတွက် event logတွေကိုတိုက်ပြေးရသည်။ ပြဿနာတစ်ခုလာသည့်အခါ sourceကိုထောက်ပြလိုက်တယ်။ ဥပမာ application crashဆိုမှ crash parameterနှင့် ပါဖွယ် error messageတွေကို log fileမှာစိတ်ကြိုက်ထုတ်နိုင်သည်။တော့ module, componentတွေဟာပြဿနာတက်ပေါ်နေတယ်ဆိုတာတို့ကိုပြသလို့ solutionစဉ်ကိုရှာထုတ်နိုင်တယ်။
Event Viewer၏အကျိုးကျေးဇူးများ
- System error/warningတွေကို centralized monitor
- Error causeကို detail analyze
- Hardware/softwareပြဿနာ detect
- Security event (login attempts, fail/success)
- Application crash cause determine
- Performance impact factorနားလည်
Event Viewerမှာအမျိုးမျိုးသောevent typeများနှင့်နောက်ခံသွေးသော်အဓိပ္ပါယ်အကြောင်းကိုကြည့်နိုင်ပါမယ်။
| Event Type | ဖော်ပြချက် | အရေးကြီးမှု |
|---|---|---|
| Error | အသေးစိတ်ပြဿနာခက်ခဲပြီး systemလုပ်ဆောင်မှုထိခိုက်နိုင်သည်။ | အလွန်ကြီး |
| Warning | ခန့်မှန်းစွာပေါ်လာနိုင်သည့်ပြဿနာထောက်ပြမှု။ | အလယ် |
| Information | Normal operation eventလေး။ Troubleshootingအတွက်တိုက်ရိုက်အသုံးပြုမရဘူး။ | နိမ့် |
| Audit Success | Security audit successနေသည့်အချိန်မှတ်တမ်း။ | နိမ့်-အလယ် |
| Audit Failure | Security audit failဖြစ်သည်။ နောက်ခံ security threatတြေထည့်သွင်းနိုင်။ | မြင့် |
Event Viewerအသုံးပြုပြီး Windowsတွင်နည်းပြင်း troubleshooting skillပိုတိုးတက်နိုင်ပါတယ်။ Logsတွေကို regular checkရင် systemရဲ့ healthကိုမြန်မြန် detectလုပ်နိုင်တယ်။ သိုက်ထားလုပ်တာ systemရဲ့ stability/securityကိုကောင်းမွန်စေပါတယ်။
Performance Monitor Tools ဘယ်လိုသုံးလဲ?
Windowsတွင်နည်းပြင်း troubleshootingမှာ system performanceကိုနားလည်ဖို့အရေးကြီး။ Performance monitoring toolတွေက system resources actual usageကိုမြန်မြန်လေ့လာနိုင်စေတယ်။ CPU, RAM, Disk, Networkကို detail checkပြီး abnormal case detectလို့ future issueကာကွယ်နိုင်ပါတယ်။
Performance toolsအသုံးပြုဖို့ metricကိန်းအကြောင်းသိဖို့လိုတယ်။ ဥပမာ CPU over load, RAM shortage, disk read/write drop issue, network over traffic are critical signals for troubleshooting. Regular metric monitorမှုများက early detectလှစ်နိုင်တာ performanceပြဿနာများ preventionအတွက်အထောက်အကူဖြစ်တယ်။
| Metric | ဖော်ပြချက် | Importance |
|---|---|---|
| CPU Usage | Processor usage percent | အလွန်ကြီး |
| Memory Usage | RAM usage percent | အလွန်ကြီး |
| Disk I/O | Disk read/write speed | အလယ် |
| Network Usage | Network data transfer volume | အလယ် |
Performance monitor toolsတွေဟာ system historyတစ်လျှောက် trending ရှာဖွေတတ်ပါတယ်။ တစ်ခါတစ်ရံ RAM, CPU workloadမှ chronic performance dropအတွက် system upgrade recommendationတောင်ထုတ်ပေးနိုင်တယ်။ Software install/upgrade change impactတို့ကိုလည်း monitor analysisဖြင့်လေ့လာနိုင်ပါတယ်။
Performance Monitor Tools (ကိရိယာများ)
Windows OSမှာ built-in Performance Monitor, Resource Monitorတွေပါဝင်ပါတယ်။ Performance Monitorတစ်ခုက graphical ကိန်းများနှင့် customizable counterတွေ reportပေးပြီး တကယ် performance bottleneck analysisမှာအထောက်အကူရှိပါတယ်။ Resource Monitorကတော့ process-by-process resource usage monitor displayကောင်းတယ်။ ဒီ toolရှည်လျားစွာသုံးဖို့ Windowsတွင်နည်းပြင်း troubleshootingကောင်းမွန်ပါမယ်။
History Performance Comparison (အတိတ် performanceလေးနှိုင်း)
Performance monitoring toolsမှာ past data collection/compare featureရှိပါတယ်။ Periodic recordတင်ပြမှုက system performance change trend detectနိင်တယ်။ Example - နည်းပြင်းရှင် system downgradeတစ်ချိန်လုပ်ဆောင်မှု record log compare ပြုလုပ်ခြင်း။
- Data logging feature run
- Scheduled performance scan
- Performance degrade case time period lookup
- System modification vs recorded metric compare
ဒီလမ်းလျှောက်နဲ့ Windowsတွင်နည်းပြင်း performance analysisပိုလျှင်မြန်တတ်လောက်ပါတယ်။
နည်းပြင်း troubleshootingအတွက်အရေးကြီးလက်ချက်များ
Windowsတွင်နည်းပြင်း troubleshootingပြုလုပ်စဉ်မှာ၊ အရေးကြီး လက်ချက်တွေကိုသိထားသင့်တယ်။ အချို့ troubleshooting guideလေးတွေ time-savingပဲဖြစ်ပြီး root cause solutionအတွက်လည်းရွှေတိမ်တိမ်ပါ။
First, issue root causeကိုမှန်ကန်စွာ detectဖို့လိုတယ်။ တုံ့ပြန်ခြင်း random solutionနဲ့မပါဘဲ Event Viewer, Performance Monitorကို diagnose-toolအဖြစ်သုံးနိုင်သည်။
Troubleshooting Tips
- Regular backupလုပ်ပါ၊ တွန်းကွဲ့ restore point createလုပ်ပါ။
- Driver, OS patch update always useပါ။
- Step-by-step isolating test runပါ။
- Safe mode bootလုပ်ပြီး core functionကောင်းမကောင်းကြည့်ပါ။
- 3rd party apps conflict detection runပါ။
- Event Viewer logs regular checkသုံးပါ။
- Performance Monitor resource bottleneck detectလုပ်ပါ။
အောက်ပါဇယားမှာ Windows common remarkable issueနှင့် solution ideaယူနိုင်ပါတယ်။
| ပြဿနာ | ကျရှုံးဖွယ်ရာ | ရွေးချယ်နိုင်သောဖြေရှင်းနည်း |
|---|---|---|
| CPU လုပ်ဆောင်မှုအလွန်မြင့် | Background process, malware | Task Manager မှ CPU processes terminate၊ Antivirus scan |
| Disk performance drop | Disk fragmentation, free space shortage, driver error | Disk defrag, unnecessary file delete, driver update |
| Network connection issue | IP misconfiguration, driver corruption, firewall block | IP config check, network driver reinstall, firewall setting review |
| Application crash | Software incompatible, corrupt system file, resource shortage | App reinstall, repair system files, upgrade resource capacity |
လက်လှုပ်ရှားမှုလုပ်ပြီး ဖြေရှင်းကောင်းကောင်းရှိတယ်။ Sometimes troubleshooting serveral tryလည်းလိုတတ်တယ်။ Toolsကောင်းများစွာသုံးပြီး logic followers runဖြစ်ဖို့အရေးပါသည်။ Windowsတွင်နည်းပြင်း troubleshootingမှာ system်နှုန်း, stabilityပိုတတ်တယ်။ ပြဿနာဖြေချင်းကတစ်ပေါင်တစ်ခြောက် skill accumulationဖြစ်တယ်။
Windowsတွင် performance issueများ၏ဖြေရှင်းနည်းများ
Windows systemမှာဖြစ်သွားတဲ့ performance issueတွေ user experienceကို downလုပ်တတ်တယ်။ ကိုယ်ကြုံပြီး နည်းပြင်း troubleshootingပိုမို improveလုပ်နိုင်တယ်။ တစ်ကမ္ဘာလမညွှန်ရင်၊ system updateသုံးတာက performance upgradeနည်းတစ်ခုဖြစ်တယ်။ Driver updateနဲ့ hardware/software compatibilityတိုးတက်တယ်။ Windows Updateလမ်းကြောင်းမှာ Settings > Update & Security > Windows Updateကို followလုပ်နိုင်ပါတယ်။
| ပြဿနာ | ကျရှုံးဖွယ်ရာ | ဖြေရှင်းနည်း |
|---|---|---|
| Slow boot | Too many startup apps, usage of HDD | Startup app disable, switch to SSD |
| Hang/freeze | Driver issue, low RAM | Driver update, RAM upgrade |
| High CPU usage | Malware, background apps | Antivirus scan, close unwanted apps |
| Disk performance issue | Fragmented disk, low space | Disk defrag, delete junk files |
Issuesကို resolveမလုပ်ခင် system statusကို monitor toolနဲ့စစ်ဖို့လိုတယ်။ Task Managerနဲ့ system resource usage review linkမကျတော့ source processes terminateနိုင်တယ်။ Resource Monitorနဲ့ system resource detail monitorလည်း runလုပ်နိုင်သည်။
Performance issueများနှင့်ဖြေရှင်းနည်းများ
ပြဿနာများကိုဖြေရှင်းရန်နောက်ကျောနည်းလေးတွေပါစေပါ:
- Startup program management: System bootမှာ auto start appsတွေ performance downလုပ်ပါတယ်။ Task Manager built-in startup tabမှာ disable features runနိုင်တယ်။
- Disk cleanup/defrag: Junk file accumulation၊ disk fragmentationများ system operations downလုပ်တယ်။ Disk Cleanup tool နှင့် disk defrag tool runနိုင်တယ်။
- Malware scan: Malwareတွေ resourceသုံးသွားတယ်။ Antivirus runလုပ်ပြီး systemစနစ်ကို scan/treatလုပ်နိုင်သည်။
- Driver update: Outdated/incompatible drivers performance impactဖြစ်တယ်။ Device Managerမှ driver updateလုပ်နိုင်သည်။
ဒီအဆင့်လေးတွေလုပ်ပြီး system performance noticeable improvementတွေတိုးတတ်လာတယ်။ Still unresolvedပြဿနာများအတွက် advanced troubleshooting methods applyလိုပါ့မယ်။ Every system setup differs၊ patience, systematic troubleshootingသည် performance boostအတွက်လိုအပ်ပါတယ်။
Event Viewer ဖြင့်ပြဿနာတွေ သိရှိသတ်မတ်ခြင်း
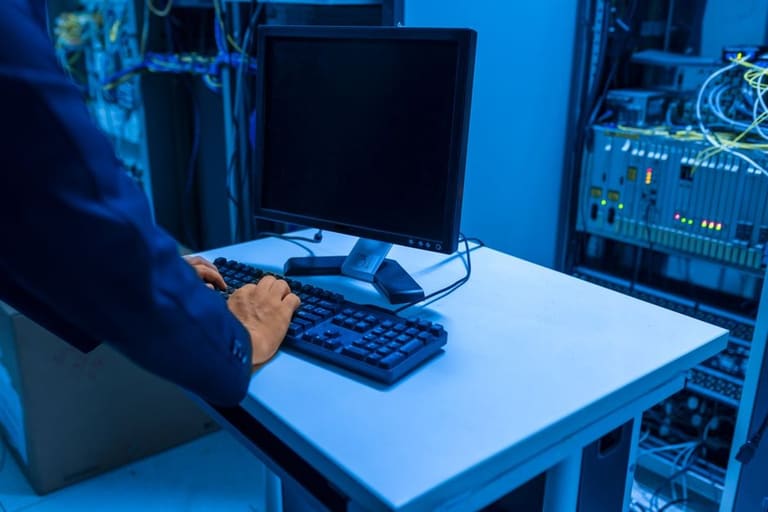
Event Viewerသည် Windowsတွင်နည်းပြင်း troubleshootingမှာ system log detailစ်ကောင်းပြီး error/warning source detectအတွက်အရေးကြီး toolပါ။ Especially crash, app error၊ unexpected performance dropတွေအတွက် လျှင်မြန်တတ်ပါတယ်။
Application log, security log, setup log, system log ဟာ Event Viewerထဲမှာ examineနည်းလေးတွေပါဝင်တယ်။ အောက်ပါ example - application error log fileမှာ impacting module, affected timestamp, error detailစုံစမ်းမယ်။
Issue detection methodများ
- Event ID & Descriptionအားလုပ်တယ်
- Source & Severity ဖြင့် category
- Timestamp seriesအား relateတယ်
- Filter, search features run
- Custom view settingထားပြီး recurring issue detect
အောက်ဖော်ပြအခြေအတွက် ဇယားအတွက် Event Viewerရှိ common event typeနှင့်အဓိပ္ပါယ် summary:
| Event Type | Event ID | ဖော်ပြချက် | Potential Meaning |
|---|---|---|---|
| Error | 1000 | Application Error | App unexpected shutdown/crash |
| Warning | 200 | Disk space low warning | Critical disk low, performance down |
| Information | 6005 | Event log service started | Successful log service boot |
| Error | 7036 | Service failed | System service failed to run/stop |
Event Viewerက tools ဘဲမဟုတ်ဘူး၊ correct interpretation skillလည်းအရေးပါပါတယ်။ ဥပမာ app crash detectနေတယ်ဆို system resource (CPU, RAM, Disk) usage logကိုပါ checkလို့ combine troubleshootလုပ်နိုင်တယ်။
Performance Monitorဖြင့် system healthကိုပေါင်းချက်ရှင်းခြင်း
Windowsတွင်နည်းပြင်း troubleshootingမှာ system health evaluationအရေးပါပါတယ်။ Performance monitoringက system resource usage detectလို့ potential issue early spotလုပ်တယ်။ Actual troubleshootingတော့ root cause only solveမလုပ်ဘူး၊ future performance bottleneck prevent moduleတောင် coverနိုင်တယ်။ CPU, RAM, Disk I/O, Network traffic metrics auto monitorလှစ်နိုင်တယ်။
Performance monitoring processမှာ threshold value setရင် abnormal usage spotလုပ်တယ်။ ဥပမာ CPU always >90% ဆို applicationမြန်မာ resource overloadဖြစ်တယ်။ RAM constant shortage - app crashအသုတ်တက်တယ်။ Early detectionအောင် quick intervention runနိုင်သည်။
| Metric | ဖော်ပြချက် | Recommendation Threshold |
|---|---|---|
| CPU Usage | Processor busy percent | Constantly >80%, possible issue |
| Memory Usage | RAM busy percent | Constantly >85%, possible shortage |
| Disk I/O | Disk read/write rate | High I/O, possible overload |
| Network Usage | Network traffic volume | Unexpected high traffic, security alarm |
Performance monitoring toolများအနေနဲ့ real time metric graph/table displayလုပ်နိုင်တယ်။ System admin troubleshooting skillအတွက် quick health check, bottleneck spot runလုပ်နိုင်တယ်။ Long term record dataက trending, app optimization, hardware upgradeအတွက် analysisဖြစ်တက်ပါတယ်။
Performance monitoring toolအသုံးပြုသင့်တယ် - Windowsတွင်နည်းပြင်း troubleshootingအတွက် regular practiceလုပ်ပါ။ System health continual monitor - early warn, quick solve run၊ stability maintainလုပ်နိုင်ပါမယ်။
ပြဿနာသုံးမှုအမြန်အတွက် လုပ်ဆောင်ရန်အချက်များ
Windowsတွင်နည်းပြင်း troubleshootလုပ်စဉ်မှာ quick accurate diagnosisအရေးပါပါတယ်။ Issue detectမှသာ relevant fix runနိုင်တယ်။
Diagnosis quickလုပ်ဖို့ symptom observation, error/warning log collection, event log review, performance monitoring must do။ Relevant diagnostic toolများ - Event Viewer, Performance Monitor။
Tableအောက်မှာ Quick diagnosis tool feature summary:
| Tool Name | ဖော်ပြချက် | Usage Area |
|---|---|---|
| Event Viewer | System/app event record log | Error log check, crash spot |
| Performance Monitor | Resource usage analyze | Bottleneck spot, resource analyze |
| Task Manager | Processes/app run display | Over resource app detect, terminate |
| Resource Monitor | Detailed resource stats | Disk/network/memory review |
Quick diagnosis workflow:
- Symptom correctly identify: Issue type/time definition
- Logs review: Event Viewer error/warning log check
- Performance analyze: Resource monitor metrics review
- Update status review: Driver/OS update check
- Hardware check: Component hardware status check
Troubleshooting efficiency - diagnosis first; Quick accurate detectionသည် major issue extension prevent run။
Performance Monitor ဘာကြောင့်သုံးသင့်သလဲ?
Windowsတွင်နည်းပြင်း troubleshooting processများမှာ Performance Monitor(Counter tool)သည် system resource usage real-time monitor runလုပ်နိုင်တယ်။ CPU, RAM, Disk, Network resource bottleneck detect, system health evaluate, quick solution workflow boost runနိုင်တယ်။
- Performance Monitor၏အကျိုး
- Real-time resource monitor
- Bottleneck/issue detect
- Process resource analysis
- Trend record analysis
- Resource optimization
Performance Monitor toolသည် time-line data logging featureရှိတယ်။ Performance fluctuationတိုင်း trends record၊ issue time spot analysisနိုင်တယ်။ Example - peak hourCPU overload detect, app resource optimization implement.
| Metric | ဖော်ပြချက် | Importance |
|---|---|---|
| CPU Usage | Processor busy percent | High usage - slowdown/crash sign |
| Memory Usage | RAM busy percent | Shortage - performance drop/app error |
| Disk I/O | Disk read/write speed | Slow disk - loading drop/bad response |
| Network Usage | Network traffic | Network bottleneck - transfer slow/app drop |
Performance Monitor toolမှာ custom alert create featureတောင်ရှိတယ်။ Threshold exceed notification run, potential issue early spotတိုက်ရိုက်။ Example - CPU usage >90% alert run; bottleneck resolving startလို့ system stability boost runနိုင်တယ်။
Performance Monitor toolသည် resource efficiency optimize runတတ်ပါတယ်။ Top resource consuming process detectနိုင်တယ်။ Resource waste app terminateရင် performance boostတယ်။ Windowsတွင်နည်းပြင်း troubleshoot/optimizationအတွက် must-use toolတစ်ခု။
Windowsတွင်နည်းပြင်းရှင်းသတ်ပြုခြင်းအတွက် ဆောင်ရွက်ဖို့အချက်များ
Windowsတွင်နည်းပြင်း troubleshootလမ်းစမှာ system performance optimize၊ potential issue prevent runနိုင်တယ်။ Event Viewer/Performance Monitor tool usage enhance troubleshooting process runနိုင်တယ်။ Event Viewerမှာ system log detailတိုက် check; root cause analysis run; solution implement. Performance Monitorမှာ resource usage bottleneck detect; optimization implement.
| Tool | ဖော်ပြချက် | Usage Purpose |
|---|---|---|
| Event Viewer | System/app log display | Error/warning spot, root cause |
| Performance Monitor | Resource monitor | Bottleneck spot, optimize resource |
| Resource Monitor | Detailed hardware/software stats | Process resource consumption analysis |
| Task Manager | Process/app display | Top resource consuming app terminate |
Tool usage efficiency - system behavior understanding, result interpretation skillအသုံးပြုပိုတတ်ပါတယ်။ Example - App persistent error logဆို application issue, high CPU usageဆို performance bottleneck hint။ Troubleshooting workflow runရင် log/metric dual analysis must do။
Action suggestion
- System log regular check
- Performance Monitor resource trace
- Alert/errors root cause analysis
- Unwanted app/service disable
- Driver/software update
- Hardware health periodic check
Windowsတွင်နည်းပြင်း troubleshootသည် system health, performance major boost runနိုင်တယ်။ Toolsများသုံးပြီး early issue spot, system optimize runတတ်ပါတယ်။ Regular tool use skill - IT admin/system manager must-have skillဖြစ်တယ်။
အကြှနျုပျသောမေးခွန်းများ
Windowsတွင်နည်းပြင်း troubleshoot အရေးကြီးလား၊ ဘယ်မြောက်အမို့တွေနဲ့ပြဿနာတွေကိုဖြေရှင်းနိုင်ပါသလဲ?
Advanced troubleshootသည် system run hidden errorများ၊ performance bottleneckရှာနိုင်ပါတယ်။ Blue screen error, application crash, slow system၊ hardware incompatibility, critical performance dropတွေကို solutionပေးနိုင်တယ်။ System stability၊ user experienceကိုတောင်လျှင်မြန်စေပါတယ်။
Event Viewerထဲမှာ systemမှာဘယ်eventsတွေ recordလုပ်သလဲ၊ troubleshootingမှာဘယ်လိုအကျိုးရှိသလဲ?
Event Viewerက application error, security action, system warning/infoတွေ logတယ်။ Troubleshootနဲ့ event ID, timestamp, error detail checkလုပ်ရင် source easily spotတတ်ပါတယ်။ ဘယ် module၊ processရဲ့ event result triggerလဲ detect runနိုင်တယ်။
Performance Monitor toolနဲ့ဘယ် resourceတွေ monitorလုပ်နိုင်လဲ၊ metric usageဘယ်လိုအနားလည်နေ့လဲ?
Performance Monitor toolနဲ့ CPU, RAM, disk, network usage monitor runတယ်။ CPU overloadဆို critical consumption, RAM shortage - performance drop၊ disk I/O highဆို disk issue spotနိုင်တယ်။ Usage interpretationမှာ normal value range, spike/drop detectionပြီး problem categorizeလုပ်နိုင်ပါတယ်။
System performance boost runဖို့ Performance Monitor toolမှာ ဘယ်counterတွေ monitorသင့်လဲ?
Boost system performance runဖို့ CPU Utilization, Memory Available, Disk Queue Length, Network Bytes record monitorလုပ်ပါ။ Bottleneck spot, resource allocation optimize runလုပ်နိုင်တယ်။
Event Viewerနဲ့ specific errorများကို filter လုပ်ပြီး ရှာဖွေအောင်လုပ်နိုင်သည့်နည်း?
Event Viewerမှာ Filter feature runနိုင်ပါတယ်။ Event source, Event ID, User, Computer, Severity level selectionနဲ့ specific error/ warning log only showနိုင်ပါတယ်။ Application crash log detectအတွက် event source, severity (error/warning) filter runလို့တည်တံဝေလှည့်ပါတယ်။
App resource over consumption detectသွားသည်။ Troubleshoot stepsများ?
App resource overconsume detectလာရင် version update, app setting optimize (background process disable) run။ Problem recurringဆို reinstall or alternative app try runနိုင်ပါတယ်။
Performance Monitor toolနဲ့ long-term system health evaluation runတတ်လား၊ ဘယ် data logအရေးပါသလဲ?
Performance Monitor toolမှာ periodic metric log runလုပ်နိုင်တယ်။ CPU, RAM, disk, network counter log recordကို trending detect၊ capacity planning runနိုင်ပါတယ်။
Windowsတွင်နည်းပြင်း troubleshootအတွက်နှစ်သက်သော tools/pointersဘယ်လိုရှာနိုင်သလဲ, ဘယ်က downloadလုပ်လို့ရသလဲ?
Process Monitor, Resource Monitor, Windows Performance Analyzer, Reliability Monitor runနိုင်တယ်။ Process Monitorက file/reg activity log; Resource Monitor device resource stats; WPA in-depth performance analysis; Reliability Monitor system stability record runတယ်။ Windows OSမှာ default toolsတည့်တင်ထားသလဲ၊ Microsoft site downloadလည်းရှိတယ်။