 Afrikaans
 Azərbaycan
 Bosanski
 Čeština
 Dansk
Dansk Deutsch
 English
 Español
 Filipino
 Français
 Hrvatski
 Indonesia
 Italiano
 Magyar
 Melayu
 Nederlands
 Norsk
Norsk Oʻzbek
 Polski
 Português
 Română
 Slovenčina
 Slovenščina
 Suomi
Suomi Svenska
 Tiếng Việt
 Türkçe
 Ελληνικά
 Беларуская
 Български
 Русский
 Српски
 Українська
 עברית
עברית اردو
اردو العربية
 پښتو
پښتو فارسی
فارسی አማርኛ
አማርኛ मराठी
मराठी বাংলা
বাংলা தமிழ்
தமிழ் ไทย
ไทย မြန်မာ
 한국어
한국어 中文
中文 日本語
日本語

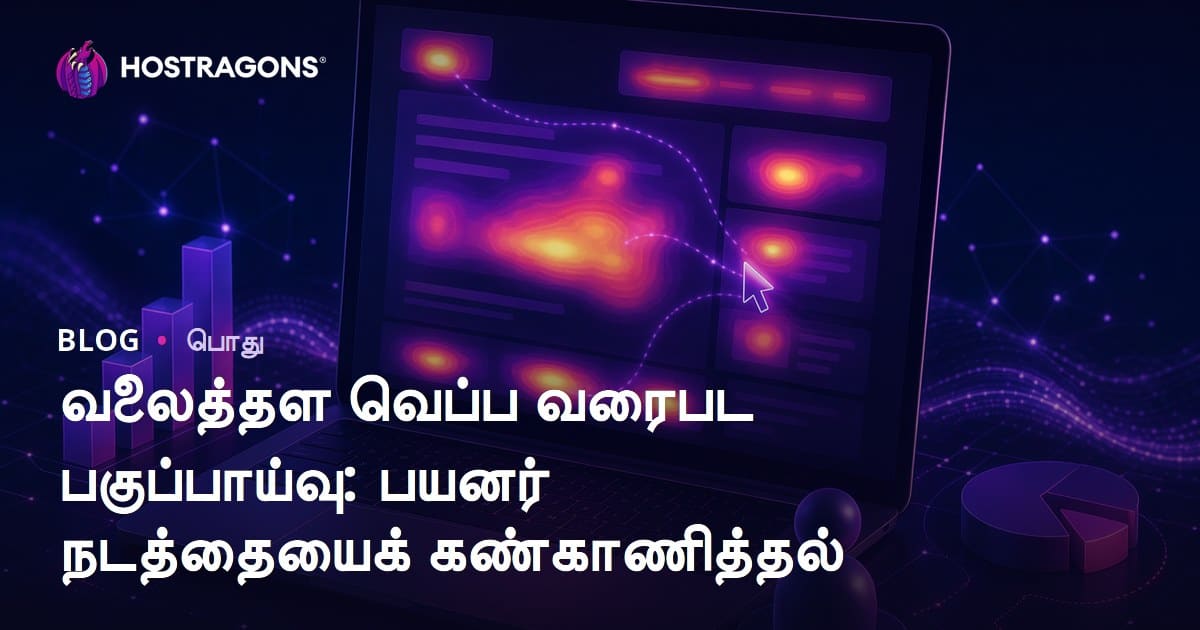
வலைத்தள Heat map (இசிஹரிதா) பகுப்பாய்வு, பயனர் நடத்தை மற்றும் எச்சரிக்கைகளை வரும் வழிகளில் பாரபரியமாக காட்டும் சிறந்த செயல்முறை ஆகும். இந்த வலைப்பதிவில், வலைத்தள heat map என்றால் என்ன, அதன் அடிப்படைத் தன்மைகள் மற்றும் பயன்கள், போலியான இடரின் வகைகள் மற்றும் அமைப்புகள், பயனர் தரவுகளை சேகரிக்கும் முறைகள் பற்றியும் — இந்த Heat map-ஐ சரியாக பயன்படுத்த வேண்டிய கவனிப்புகள், சாதாரண வழிபாடுகளும் தீர்வுகளும், ஒரு Heat map பகுப்பாய்வு எப்படிச் செய்ய வேண்டும் என்பதையும், பெற்ற தகவல்களை மேம்பாட்டு மூலமாகக் கொண்டு நடக்கும் புதிய பழக்கங்கள் மற்றும் உபயோகப்படுத்தும் platform-கள் பற்றியும் அறிந்து கொள்ளலாம். முடிவில், Heat map பகுப்பாய்வின் வலைத்தள மேம்பாட்டில் வழங்கும் வலிமையும் எதிர்கால வாய்ப்புகளையும் எடுத்துரைப்போம்.
Heat Map என்றால் என்ன? அடிப்படைக் கருத்துகள் மற்றும் உருவாக்கங்கள்
வலைத்தள heat map என்பது, ஒரு webpage-ல் பயனர்கள் எங்கே click செய்கிறார்கள், mouse-ஐ எப்படிச் செலுத்துகிறார்கள், எவ்வளவு நேரம் spend செய்கிறார்கள் என்பதை visual-ஆக காட்டும் tool. இதில், சுடுகாட்டான (red/orange/yellow) நிறங்கள் அதிகச் சந்திப்பு, குளிர்ந்த (blue/green) நிறங்கள் குறைந்த இலவசை காட்டும். அந்த maps UX (user experience) மற்றும் conversion rate போதியும் web administrator/market-க்கு செரிய அணுகுமுறை தரும்.
Heat map-கள் பொதுவாக - click maps, mouse tracking maps, scroll maps என multi-type-ஆக வருகிறது. Click maps - எங்கே click செய்கிறார்கள், mouse movement maps - mouse எங்கு how_USE இருக்கிறது, scroll maps - ஏற்கனவே எவ்வளவு content scroll பண்ணினார்கள் என காட்டுகிறது. பல வகை Heat map-கள், வலைத்தள user நடத்தை பற்றி பல பக்கத்திலும் detail தகவல் வழங்கும்.
| Heat Map வகை | விளக்கம் | பயன்பாடுகள் |
|---|---|---|
| Click Map | பயனர்கள் click செய்த வெளிகளை visual-ஆக காட்டும். | Button/Link conversion மற்றும் performance measure. |
| Mouse Tracking Map | Mouse movement ஒட்டும். | பயனர்களை distract செய்யும் item-கள் & content layout improve. |
| Scroll Map | Scroll depth பற்றி காட்டும். | Content visibility உயர்த்து layout arrangement optimize. |
| Attention Map | நிறைய கவனித்த இடம் highlight செய்கிறது. | Page layout, key content visibility. |
வலைத்தள Heat map-கள் UX, conversion, design எல்லாவற்றையும் optimize செய்ய foundation தரும். Click செய்யாத button-களுக்கு design/location மாற்றி result உயர்த்தலாம். அனுபவமான data-யை கொண்டு decision எடுத்தால் மாத்திரமே வலைத்தள அதிக புகழ் பெறும்.
- பயனர் நடத்தை தெளிவாக புரிந்து கொள்ள
- வலைத்தள layout, design விடுபாடு
- Conversion rate-ஐ உயர்த்தும்
- UX மேம்பாடு
- Data-driven decisions easy ஆகும்
- மாறி வரும் digital marketing கணக்குகள்
Heat map பகுப்பாய்வின் முக்கியத்துவம்
இவை பயனர்கள் எப்படி interact செய்கிறார்கள் என்பதை அறிவும், site-ஐ அவர்களின் real expectation & use case-க்கு ஏற்ப தரவும் வழிகாட்டும்.
பயனர் நடத்தை அறிந்து கொள்ள Heat Map பயன்பாடுகள்
வலைத்தள Heat map-கள், உங்கள் site-யில் பயனர்கள் எப்படி செய்கின்றனர் என்பதை திரும்ப விரிவாக visual-ஆக காட்டுது. எடுத்துக் கொண்டால் எந்த buttons/links அதிக உருட்டல் போடுகிறது, எந்த content zone அதிக விவரிக்கப்படுகிறது, எவ்வளவு duration site-ல் இருக்கிறார்கள், தெளிவாக தெரியும். இந்த visual data, UX optimization & conversion என்ற முக்கிய வைபாக்களுக்குத் தவிர, site செய்யப்பட்ட marketing tweak-கள் அனைத்திற்கும் base data-யாகின்றது.
Traditional web analytics (pageviews, bounce rate, session duration) metrics அளிக்கும் basic overview, ஆனால் Heat map real-time behavior மற்றும் layout/framework அனைத்தையும் granular breakdown-ஆக வழங்கும். இதற்கு அமைவாக - site design, content alignment, user flow, navigation optimisation போன்ற deep-level strategic decisions எடுக்கலாம்.
- பயன்கள்
- பயனர் நடத்தை visual-ஆக பயனம் பெறும்
- வலைத்தள UX, design தெரியாத data வழங்கும்
- Conversion rate மிகச்சிறந்த chance ஏற்கும்
- Distract செய்யும் zone-கள் பத்திரமாக சொல்லும்
- A/B testing planning-க்கு insightful data
- Mobile compatibility issue detect செய்ய easy-ஆகும்
Heat map-கள் அதிக click zone-கள், scroll depth, neglect செய்கின்ற content-கள், etc. — அனைத்தும் உருட்டித் தருகிறதனால், site-யை user real need-களுக்கு align செய்யலாம்.
A/B tests-க்கு, design/content variation-கள் impact-ஐ visual-ஆக வந்தையும் - எந்த மாற்றம் best-performing என்பதை bullet அது காட்டி site subjective improvement-ஆக உருகும்.
Heat Map வகைகள் மற்றும் பண்புகள்
Site-ல் behavior visualise செய்வதற்கான Heat map-கள் பன்மாறான format, sample மற்றும் data-driven insights-ஐ unlimited அவகாசம் கொண்டிருக்கிறார்கள். அவை, click, scroll, mouse movement, hover zone, eye-tracking என வடிவமைக்கப்பட்டது. ஒவ்வொரு வகையும் சரியான use-case-க்கு tailor-cut insights தரவரும்.
| Heat map வகை | Core characters | Best suited area | Data source |
|---|---|---|---|
| Click Map | Click hotspots | Button, link, CTA performance audit | Click count |
| Scroll Map | Scroll depth visualisation | Content engaging-ness measure | Scroll percentage data |
| Move Map | Mouse movement | Interest zone find | Mouse path data |
| Hover Map | Mouse hover duration | Form/critical content intensity measure | Hover time |
Heat map-வகைகள், உங்கள் analyse-ஐ comprehensive & multilevel-ஆக செய்ய தரும். Conversion/UX vital decisions எடுக்க, right combination உள்ள Heat map-களை பயன்படுத்த வேண்டும்.
Heat Map வகைகள்
- Click Maps: எங்கே click ஏற்கின்றது, interaction element performance க்கு best.
- Scroll Maps: Scroll depth, content attractiveness, site breakpoints தெரியும்.
- Mouse Movement Maps: Mouse path, focus zone detect செய்யண்டு.
- Hover Maps: Mouse hold behaviour, content blocks interactivity, form validation.
- Eye-Tracking Maps: அறிவியல் வெவ்வேறு hardware-யுடன் gaze movement sample.
இவை design/content optimization-க்கு customised view தரும். Targetப்போடு தேவையாக்கக் கொள்வது சிறந்தது.
சூடான வரைபடம்
சூடான வரைபடத்திலே, webpage user interaction visual-ஆக (color-coded) குறித்து, அதிக hotspotக்கு red/orange/yellow code, குறைந்த இடத்திற்கு green/blue code காட்டு. UX improve பணியாளர்-க்கு இவை priority zone fetch செய்ய கொஞ்சம் கிளிகமான visual aideயாகும்.
தள்ளும் வரைபடம்
Scroll Map, site content போய்க் கொண்டிருக்கும் zoneக்கான scroll-depthக்கு நடந்துக்கொள்ளும் visual analyse. அங்க scroll depth sets கேட்காமல் போனால், major content விண்ணபம் செய்ய, reposition/visibility improvements பரிந்துரைத்து நெறி அமைக்கும்.
Correct Heat map category select — optimize cadre & UX"sync" -க்கு விஷயம்.
Heat Map பகுப்பாய்வில் பயனர் தரவு சேகரிப்பு முறை
வலைத்தள Heat map தயாரிப்புக்கான data-fetch பயனர்கள் UX முன்னேற்றம் மற்றும் conversion boost சொந்தமாகும். பரிசோதனையில் Data source வாயிலாக பெரிய வித்தியாசம் காட்டும். Commonly, observation, survey, user test, analytics tools பயன்படுத்தப்படும். ஒவ்வொரு நிலையும் pros/cons கொண்டது; உங்களுக்கு பொருத்தமானதைத் தேர்ந்தெடுக்கும் மிக முக்கியது.
Observation method - real-time user site-ல் என்ன செய்கிறான்னு நேரில் பின்தொடரும். இது interaction, click, struggle என்று spot தீர்வு காட்டும். நேரடியான observation கொஞ்சம் பெரிய scale-க்கு lengthy. Survey ஆகியது - user opinion, expectation, feedback collect செய்ய best. Survey questions பற்றி மிக விழிப்பாக, target audienceக்கு எமாற்றம் செய்வது அரியிருக்க வேண்டும்.
| Data Collection method | Advantages | Drawbacks |
|---|---|---|
| Observation | Live user behaviour, granular insights | Time-consuming, large scale hard |
| Survey | Opinion gathering, targeted feedback | Low response, bias |
| User Test | Behaviour monitor, usability problem discovery | Costly, limited audience |
| Analytics Tools | Automated large scale data, aggregative stats | Motivation, deep intent discover செய்ய முடியாது |
User test — Site usability, problem-spotting-க்கு purpose-built. Lab-களில் பின்தொடரும் video-driven/voice record-ன் கொண்டு “real” feedback fetch செய்ய முடியும். Analytics tools (ex: Google Analytics), traffic, pageview, click-rate, conversion-rate போன்ற metrics சீக்கிரம் fetch செய்ய help-ஆகும்.
Heat map user data collection flow முறையாக setup செய்ய, set of actions: clear goal, right tool selection, method choosing, data collection process, data cleaning, analysis, reporting அனைத்தும் smart-ஆக செயல்படும்.
- Goal definition: What/problem/question analyse செய்யவும்.
- Tool selection: Relevant Heat map software pick.
- Method choice: Observation/survey/user test/tool எப்படி பக்க setup செய்ய வேண்டும்.
- Collection phase: Define zone, duration, frequency.
- Data cleansing: Error/remove, refine data
- Analysis: Insights, pattern spotting
- Reporting: Visual chart & dashboard presentation
வலைத்தள Heat map data collection, clear-cut process, right resource-க்கு conform-ஆக மட்டும்wiritுபோம். Adherence, data quality & meaningful outcome-க்கு foundation. Careful setup, above steps follow ஒவ்வொரு time best output.
மெய்யான தரவை கூட்டினால் நல்ல பகுப்பாய்வு முடியும்.
Heat Map செயல்பாட்டில் கவனிக்க வேண்டியவை
வலைத்தள Heat map-செயலித்தலில் சிறப்பாக data-ஐ visual-ஆக fetch செய்யலாம். ஆனால் correct setup, proper analysis, careful interpretation இல்லாமல் misleading result & incorrect optimization-க்கு வழிவாகும். பரிசோதனை - every phase (collection, analyse, change) strict & scientific-ஆக நடக்கவேண்டும்.
இங்க collected data meaningful & right-representation-ஆக இருக்க வேண்டும். First analyse செய்ய page-wise priority (payment, product detail, etc), site goals, user journey review செய்யவேண்டும். Device variation (mobile/desktop) behavior difference catch செய்ய dual map-களை உருவாக்க வேண்டும்.
- காலத்தைச் சரி பார்க்க வேண்டும்
- Data privacy, GDPR etc. law-க்கு conform-ஆக setup செல்ல வேண்டும்
- Heat maps general analytics-உம் படி combine செய்ய வேண்டும்
- Seasonal behavior, time-range-களை track செய்ய வேண்டும்
- A/B testing results-உம் validate செய்ய வேண்டும்
- Heat map result often audit & review செய்ய வேண்டும்
Interpretation-க்கு visual பட்டுமே அதிக பற்று வைப்பதில் பிழை. Zone-க்கு click/dwell ratio அதிகமானது “interest”ால் மட்டுமல்ல, “confusion”காகவும் வரலாம். User interviews/surveys கூட supplement செய்யலாம். Heat map acting as first reference point; subsequent contextual/content/layout changes நல்லதை உருவாக்கும்.
| Heat map type | Goal | Care points |
|---|---|---|
| Click Map | Clickable zones visualise | Dead link/error click detect |
| Scroll Map | Content reach review | Important content visibility max |
| Mouse Map | Mouse flow trace | Hotspot zone/attention area |
| Attention Map | Focus zone | CTA/message layout perfection |
Heat map-based review a continuous loop. Change-do-response measure, new tweak-கள் implement செய்ய process-ஐ repeat செய்ய வேண்டும். User-centric approach always best-ம்; correct deploy-ஆகும் வெற்றி.
Heat Map வழகரில் பொதுவாக செய்யப்படும் தவறுகள் & தீர்வுகள்
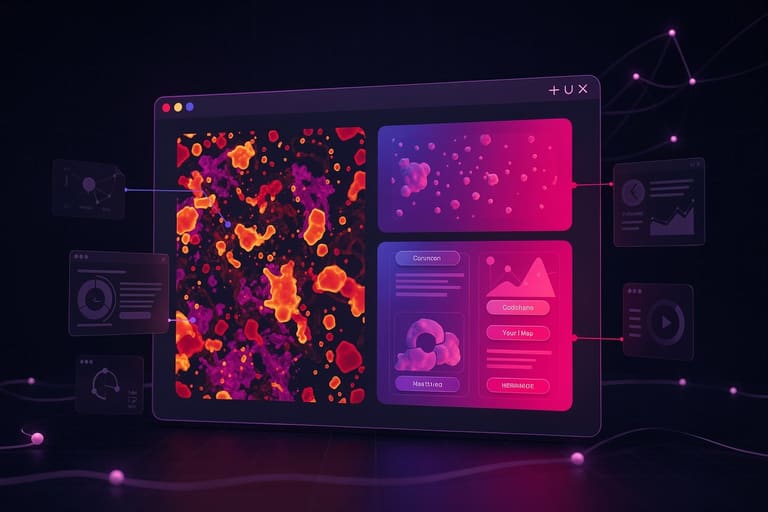
வலைத்தள Heat map, site-ல் user activity-ஐ visual-ஆக showcase செய்கின்றது. But, flawed setup/interpretation misleading data-க்கு வழிகாட்டும். Common pitfalls-உம், correct fix-உம் analyse செய்தால், tool power maximise ஆகும்.
Many misread heat maps as mere picture. Deep insight, pattern correlation செய்யாமல் superficial analyse செய்யும். Additional analytics (Google Analytics etc.) integrate செய்ய user behavior influencer connect செய்ய வேண்டும்.
| பிழை | விளக்கம் | திருத்தம் |
|---|---|---|
| Insufficient Data | Short run/low visitor samples | Longer run, ample user data |
| Wrong tool | Misfit, misconfigured | Right, tested, firm-fit tool |
| Isolated Analysis | No correlation/other metrics | Combine heatmap, analytics |
| Overinterpret | Minor variation over-explained | Statistical significance check |
Correct interpretation crucial. A hotspot may signal interest or confusion. Validate with surveys/test. Data to action required; otherwise just theory, not practice.
- பிழைகள் & தீர்வுகள்
- பிழை: Short data span; திருத்தம்: longer analyse, larger sample.
- பிழை: Wrong map type; திருத்தம்: purpose-fit map.
- பிழை: Ignore mobile; திருத்தம்: device-wise map.
- பிழை: No A/B test; திருத்தம்: multi-design trial.
- பிழை: No user feedback; திருத்தம்: Survey/test parallel.
- பிழை: Outdated data; திருத்தம்: Refresh after update/change.
Result must be implemented, not mere report. Continuous monitoring plus change loops success-க்கு வழிகாட்டும்.
Heat Map பகுப்பாய்வு செய்யும் நடைமுறை
வலைத்தள Heat map analyse, முடிகள் எப்படி site-அனை interact செய்வதை live_showcase செய்ய visual-ஆக prompt insights fetch செய்யும். Click hotspot, attention span, confusion zone, failure case எல்லாம் படக்குறிக்க UI/UX, conversion tune செய்ய பரிந்துரை.
Analyse preparation: goal-definition (target page/user behaviour/problem history), example: e-commerce-க்கு product page click & blog-க்கு scroll depth analyse. Precise targets success outcome-க்கு lead pave.
| Analyse step | Process | Key metrics |
|---|---|---|
| Goal definition | Target & scope definition | Conversion, bounce ratio, pageviews |
| Data collection | Heat map tool integration | Click %, scroll depth, mouse trace |
| Analysis | Visualisation & interpretation | Hot zones, neglected sections, pattern |
| Improvement | UI, layout, content refactoring | A/B test, design, content update |
Collect alone not enough; interpretation, hypothesis and change-loop mandatory. Example: Low click-area reason — unattractive design/content or poor placement. Insight-driven tweaking UX & conversion tightens.
Continuous improvement cycle: data-fetch, analyse, modify, monitor, repeat.
- Goal framing: Question/problem statement ready.
- Tool setup: Right Heat map software install/config
- Data gather: Enough sample, wide user base
- Pattern analyse: Hot/cold spot trace, problem area
- Hypothesis: Improvement suggestion-list
- A/B test: Trial changes, result monitor
- Follow-up: Success measure, further refine
Heat Map datாவுடன் மேம்பாட்டு அறிவுகள்
Heat map analyse-கள், user behaviour-ஐ target insightsல் spill செய்கிறது. Content, layout, CTA — எந்த zone maximise interest, conversion, struggle என்று mobile proof-ஆக spot செய்ய தருகின்றது. Proper interpretation மூலமாக UX/click-rate/conversionல் நல்ல result possible.
| Heat map data | Possible issue | Improvement idea |
|---|---|---|
| High CTR | Positive result area | Retain layout; replicate elsewhere |
| Low CTR | Zone visibility/interest low | Position/design/content tweak |
| Long page stay | Content engaging | Expand/supplement content |
| Short stay | Complicated, poor interest | Simplify, enhance search navigation |
User-first attitude: analysis, feedback, improvement — continuous cycle. Example, low click for link — design/position/wording refine. Long scroll zone: push key info top/visual highlight.
- A/B test: Multiple design/content variant check
- Mobile optimise: Mobile-specific behaviour spot, tune
- CTA button enhance: Position/design/wording trial
- Loading speed: Optimize, reduce bounce
- Form field simplify: Remove bar, basic info only
- Content update: Focus demand/topic/domain
Heat map data continuous monitor, recurrent improvement, seasonal variation, market expectation, user demand adapt செய்ய வேண்டும். Data-informed culture success pave.
Heat Map அப்பரை உபயோகப்படும் Tools & Platforms
வலைத்தள Heat map data, user behaviour visual analyse செய்ய variety of tools/platforms support. Small blog/e-commerce/portfolio என்று எல்லாம் suitable, scalable, budget-fit படிப்பை select செய்ய வேண்டும்.
| Tool/Platform name | Key features | Pricing |
|---|---|---|
| Hotjar | Heat maps, session record, survey, feedback | Free, premium based features |
| Crazy Egg | Heat maps, confetti, overlay report, A/B test tool | Subscription, variety packages |
| Mouseflow | Heat maps, session record, form, funnel | Free trial, paid scale by traffic |
| Lucky Orange | Heat maps, session record, live chat, survey | Subscription, traffic-based |
Market-ல் leading tools — UI, session/video, form analysis, conversion funnel, A/B test, dashboard. Features-richer & ease-of-use tool pick செய்யுங்கள்.
- Hotjar
- Crazy Egg
- Mouseflow
- Lucky Orange
- FullStory
- Inspectlet
Tool pick criteria: site traffic, budget, features, privacy (GDPR), security-policy, data anonymity, ethical use. Free trial/limited plan palette-க்கு try செய்து right pick செய்யுங்கள்.
Heat Map analyse-ன் பலம் & எதிர்காலம்
வலைத்தள Heat map analyse, user behaviour, layout flow, conversion opportunities, mistake areas அனைத்தையும் visual/graphical breakdown பார்த்து, tailor-made suggestion உயிர்பசைக்க இயக்கும். UX/clickability/content change & overall performance elevation-க்கு base foundation தரும்.
| Feature | Explanation | Benefits |
|---|---|---|
| Click map | Click pattern/data | Hotspot/high-interest content spot |
| Scroll map | Scroll reach pattern | Content exposure/visibility measure |
| Mouse map | Mouse movement | Interest/confusion zone detect |
| Form analytics | Form process/timing/abandonment | Form conversion improvement possible |
Heat map-based find & fix, UX, conversion ready-made. Example: Button no click - reposition, recolour, reword; bottom neglect - content highlight reposition. All iterative improvement possible.
- Goal set: Clear question/problem-focus
- Tool fix: Best software/platform pick
- Data gather: Ample sample runtime
- Analyse: Visual, pattern, hypothesis
- Change apply: UI/content/layout improvement
- Test: A/B, multivariant compare
- Monitor: Outcome, new tweak
Future-oriented: AI, ML, AR/VR integrate -- granular behaviour, real-time personalisation, advanced insight unlock. Heat map analyse site success-க்கு standard tool வழிகாட்டும்.
வலைத்தள Heat map analyse, competitive digital success-க்கு absolutely நம்பிக்கையான tool. User behaviour படி site-ஐ tune செய்யுங்கள்!
அடிக்கடி கேட்கப்படும் கேள்விகள்
Heat map-கள் வலைத்தளத்தின் எந்த வகையான measurable பலன்களை தரும்?
Heat map-கள், user behaviour visualise செய்ய, UX/high conversion/optimise layout/all time measure, bounce-rate reduce/reputation grow செய்து, site success pave செய்கிறது.
எந்த Heat map வகைகளை எப்போது பயன்படுத்த வேண்டும்?
Click map: Interaction audit; mouse movement map: interest/confusion zone detection; scroll map: content exposure. Each purpose பிளஸ் device, goal, analysis suit செய்ய தேர்வு செய்ய வேண்டும்.
Heat map அப்பரைம் ஆரம்பிக்க என்னென்ன முன்னாள் பரிசோதனைகள் வேண்டும்?
Goal-setting (target pages, behaviour, problem area), privacy-policy update, GDPR model, user tracking consent, analytics integration—all essential.
GDPR போன்ற privacy regulation-கள் Heat map analyse-னில் impact?
Consent, anonymise, data-access/delete-right, secure archive, plus open policy disclosure, are must compliance.
Heat map data, interpretation & action வழிகளில் எப்படி அப்பரியல் செய்ய?
Pattern, trend, hotspot trace; neglected zone spot, content/design/layout tweak—every insight implement. Example: Low click—visual highlight/position; scroll ratio—key content shift up.
Free/Premium Heat map tools main difference?
Free tools: Limited feature, short history, traffic cap. Premiums: Advanced tracking, segmentation, long archive, high traffic support. Site size/budget-க்கு tool fitக் கண்டறிக.
Heat map device-wise (desktop/mobile) பயன்கள்?
Mobile: Touch behaviour, scroll ratio, attention zone analyse; Desktop: Mouse click, hover, scroll area measure. Device-specific map-க்கு tweak செய்ய, UX optimise உயரும்.
Heat map analyse periodicity — regular audit-க்கு படிப்பேண்டுமா?
High-traffic/periodic major change பிறகு analyse செய்து, monthly/quarterly review, continuous monitor—outcome elevation, trend check, early problem spot.