 Afrikaans
 Azərbaycan
 Bosanski
 Čeština
 Dansk
Dansk Deutsch
 English
 Español
 Filipino
 Français
 Hrvatski
 Indonesia
 Italiano
 Magyar
 Melayu
 Nederlands
 Norsk
Norsk Oʻzbek
 Polski
 Português
 Română
 Slovenčina
 Slovenščina
 Suomi
Suomi Svenska
 Tiếng Việt
 Türkçe
 Ελληνικά
 Беларуская
 Български
 Русский
 Српски
 Українська
 עברית
עברית اردو
اردو العربية
 پښتو
پښتو فارسی
فارسی አማርኛ
አማርኛ मराठी
मराठी বাংলা
বাংলা தமிழ்
தமிழ் ไทย
ไทย မြန်မာ
 한국어
한국어 中文
中文 日本語
日本語


ကုမ္ပဏီတွင် အလျားလိုက်အထူးအတည်ပြု အစီရင်ခံစာများသည် လုပ်ငန်းအလိုက် အနာဂတ်ကျသည့် မက်ထရစ်များ/ဒေတာများကို စစ်တမ်းထုတ်ယူနိုင်စေရန် ဖန်တီးထားသော ရှင်းလင်းအကြောင်းအရာတွင်လည်း အသုံးဝင်ပါသည်။ ဒီ blog လမ်းညွှန်အတွင်း၊ အထူးအစီရင်ခံစာတစ်ခုကို ဘယ်လို လုပ်ဆောင်ရမယ်ဆိုတာ တစ်ဆင့်ချင်း အကြောင်းဖော်ပြထားပြီး၊ စတင်ဒေတာရွေးချယ်ခြင်းမှ စတင်သောလုပ်ဆောင်ပုံ၊ တည်ဆောက်သည့်နည်းလမ်းများ၊ နှိုင်းယှဉ်နိုင်မှု၊ လုပ်နည်းနှင့်သုတေသနများအထိ အပြည့်အစုံ ပုံစံထုတ်ပြသထားပါတယ်။ ဤ့အစီမံအတွက် အသုံးချလုပ်ပုံအများစု၊ ကောင်းမွန်တဲ့ အထူးအတည်ပြု အစီရင်ခံစာများမှာ ရထားသော ဦးတည်ချက်များနှင့် လုပ်နည်းနကောင်း၊ ကိုယ်ပိုင်လုပ်ငန်းစဉ်တွင် ထည့်သွင်းအသုံးပြုနိုင်အောင် အတည်ခံလမ်းညွှန် ဦးတည်ချက်တစ်ခုအဖြစ် ထည့်သွင်းတင်ပြထားပါတယ်။ နောက်ဆုံးသို့ မက်ထရစ်သုံးခြင်းနဲ့ သတ်မှတ်ချက်လေးများပေါ်အခြေခံပြီး ကုမ္ပဏီတစ်ခုသည် ဒေတာအပေါ်လမ်းညွှန်အဖြစ် ကောင်းမွန်တဲ့ ဆုံးဖြတ်ချက်ယူနိုင်ရေး၊ လုပ်ငန်းမူပိုင်မှု တိုးတက်မှုအတွက် တကယ်အသုံးဝင်တဲ့ တည်ဆောက်ဆောင်ပုစ္ဆာတွေလည်း ထည့်သွင်းဖော်ပြထားပါတယ်။
အထူးအစီရင်ခံစာ ဆိုတာ ဘာလဲ? အရေးပါမှု ဘာတွင်ရှိသလဲ?
အထူးအစီရင်ခံစာ ဆိုတာ သာလျှင် General report tool တစ်ခုမှထွက်တဲ့မှာရှိတဲ့ အတိုင်းအတာမဟုတ်ပဲ၊ တစ်ခုခုနေရာမှာ သင့်လုပ်ငန်းအတွက်ပုံစံထုတ်နည်း၊ ဦးတည်ချက်အလိုက် တစ်ဆင့်ချင်း analysis တစ်ခုဖြစ်ပါတယ်။ ဒီဒေတာများသည် မတည်မဖြစ်ပေါ်လာတဲ့ ၊ တိကျမှု၊ ဦးတည်မှုများနှင့်လုပ်ငန်းအလိုက် ပြုပြင်ပေးနိုင်မှသာ လုပ်ငန်းတိုးတက်မှုအတွက် အရေးပါဆုံး tool တစ်ခုဖြစ်လာပါတယ်။
အထူးအစီရင်ခံစာတစ်ခု၏ အရေးပါမှုသည်၊ တိကျသော analysis၊ ကိုယ်ပိုင်သုံးစွဲနိုင်သော insight များမှာပါဝင်လာပါတယ်။ General report တစ်ခုပြုလုပ်စဉ်အဘို့၊ အထူးစီရင်ခံစာတစ်ခုပြုလုပ်ခြင်းမှာ တစ်ခုတည်းသော project များ၊ နေရာထဲ၊ process အသီးသီးအတွက် ကောင်းမွန်သော performance/metric တွေရရှိလာနိုင်ပါတယ်။ ဒီအမျိုးအစား report များစွာ သုံးစွဲခြင်းကြောင့်၊ မည်သည့်အပိုင်းများအောင်မြင်နေပါတယ်၊ မည်သည့်အပိုင်းများဖောက်ပြန်မှုလိုအပ်သလဲဆိုတာ လစဉ်လုပ်ငန်းအတွက် ထိအရေးကြီးသော data-driven analysis တစ်ခုမြဲဖြစ်လာနိုင်ပါတယ်။
| ထူးခြားချက် | General အစီရင်ခံစာ | အထူးအတည်ပြု အစီရင်ခံစာ |
|---|---|---|
| Scope | ကျယ်ပြန့်, အထွေထွေ ရှုခင်း | ကျဉ်း, အသေးစိတ် analysis |
| အတည်ပြုနိုင်မှု | နည်းပါး | မြင့်မား |
| ဦးတည်ချက် | Overall performance follow-up | အထူးဦးတည်ချက်အပေါ် data insight |
| အသုံးပြုမှု နယ်ပယ် | မှတ်တမ်းများ follow-up | ခေါ်ယူ နည်းလမ်းဆုံးဖြတ်ခြင်း |
ထို့အပြင် အထူးအစီရင်ခံစာများ အသုံးပြုခြင်းက အနာဂတ်အတွက် market လှုပ်ရှားမှုပြောင်းလဲသွားတာကို ကိုက်ညီအောင် adaptive လုပ်နိုင်စေပါတယ်။ မည်သည့်မှာ customer ကိုယ်တိုင် data ကနေလည်း သိရှိနိုင်ချိန်၊ market changing ဖြစ်တဲ့အချိန်မျိုးမှာ အထူးအစီရင်ခံစာတွေဟာ လုပ်ငန်းတော်တော်တစ်ခုအတွက် essential tool ဖြစ်သလို၊ risks minimize လုပ်နိုင်ပြီး၊ opportunities များကလည်းပိုမို အသစ်တွေ အားသာချက် အနေနဲ့နဲ့တင်ပါ။
အထူးအစီရင်ခံစာအကျိုးပြု
- အသေးစိတ် တစ်ခုတည်း analysis: Key metrics များအပေါ်အခြေခံပြီး deep insight ကို digital နောက်ခံ data များမှ server-side မက်ထရစ်တွေ သီးသန့် ရယူနိုင်ခြင်း။
- ကိုယ်ပိုင် insight: စဉ်ဆက်မပြတ် update လုပ်နိုင်တဲ့ တစ်ခုတည်းသော business needs အပေါ် အစီရင်ခံစာတစ်ခု measurements များကိုပေးအပ်နိုင်ခြင်း။
- Decision-making: Data-based အဆင့်ဆုံးဖြတ်ခြင်း process ကို support ပေးခြင်း။
- Performance ပိုမိုတိုးတက်စေရန်: Business ရဲ့အောင်မြင်တဲ့ နယ်ပယ်တွေနဲ့၊ ပြန်လည်ပြုပြင်ဖို့လိုအပ်တဲ့ နာမည်ခပ်ထားတဲ့ points များကို feature-highlight လုပ်ခြင်း။
- Competitive Advantage: Market ပြောင်းလဲလာတဲ့အချိန်မှာ customer insight များ သေချာစွာ သိရှိနိုင်ခြင်း။
- Risk Management: Data analysis ပေါ်အခြေခံပြီး risk minimize လုပ်နိုင်ခြင်း။
အထူးအစီရင်ခံစာ သုံးလျှင် transparencyတိုး၊ accountabilityလည်း တစ်ကိုယ်တိုင် မော်နယ်မှတစ်ဆင့် ရရှိနိုင်ပါတယ်။ ဦးတည်တော်တော် data report တစ်ခုလွန်ဆက်တွဲပြီး မည်သည့် stakeholder မဆို ကိုယ့်လုပ်သားများယုံကြည်မှုတိုးနော်၊ ရေရှည်အောင်မြင်မှုအတွက်လည်း ချိတ်ဆက်တယ်။
အထူးအစီရင်ခံစာ ဖန်တီးခြင်း လုပ်ဆောင်မှုအဆင့်များ
အထူးအစီရင်ခံစာ တည်ဆောက်ခြင်းလမ်းစဉ်မှာသင့်လုပ်ငန်းအတွက် တစ်ခုတည်းသော analysis တွေကို build-in နည်းလမ်းဖြစ်လာပါတယ်။ ဒီ process တွေက ဦးတည်ချက်အပေါ်အခြေခံပြီး planတစ်ခုဖြစ်လာသလို၊ တစ်ဆင့်တစ်ဆင့် follow-up လုပ်ရပါမယ်။ မည်သည့်လုပ်ငန်းဟာ စီးပွားရေးရည်မှတ်တစ်ခုပေါ် ဆောင်ရွက်တဲ့အချိန်မှာ report များဟာ ကိုယ့် data တွေကို knowledge ပေါင်းသင်းစီမံအောင်မြင်မှု အောက်ခံရ စွမ်းအားတိုးနည်းမှထောက်ပံ့ပါတယ်။
အထူးအစီရင်ခံစာပြုလုပ်ခြင်း၊ General report တစ်ခုမှမရနိုင်တဲ့ deep-level data insight များကိုဖြစ်ပေါ်အောင်လုပ်နိုင်ပါတယ်။ တစ်ခုတည်းသော project တစ်ခုပေါ်၊ department တစ်ခုသစ်၊ customer segments တစ်ခုဆိုင်ရာ analysis တွေကိုတိုင်း-tune လုပ်နိုင်ပါတယ်။ Process တွေမှာ data collect, analyze, reporting လုပ်ရပါတယ်။ တစ်ခုချင်းစီ process များကို business needs အပေါ် ကောင်းမွန်စွာအောင်းမြန်ကာလုပ်ဆောင်ဖို့ လိုအပ်ပါတယ်။
| အဆင့် | ဖော်ပြချက် | အရေးကြီးချက်များ |
|---|---|---|
| ဦးတည်ချက်သတ်မှတ် | Report ရဲ့ လုပ်ယူမှု၊ တစ်ခုတည်းသော question များကို ပြေလည်စေရန် သတ်မှတ်လို့ရပါတယ်။ | SMART objectives – Specific, Measurable, Achievable, Relevant, Time-bound လုပ်ဖို့။ |
| Data မြှုပ်ကွက် | လိုအပ်တဲ့ data ကို source မည်ကနေ collect နိုင်လား သတ်မှတ်။ | Data quality၊ trustworthiness တိုးလျှင် data cleanလုပ်ထပ်စီမံ။ |
| Data Analyze | Data က collect ပြုပြင်ပြီး idea များထုတ်လာတဲ့အချိန်။ | Regression, variance analysis နည်းစာရင်းများသုံး။ |
| Report Creation | Results ကို visual presentation & summary တစ်ခုဖြစ်အောင် sun ။ | Graphs, tables, summary – information ကို effective communicate ပေး။ |
Good report process မှာ ဒီအဆင့်တွေကို အနားတစ်လှည့်တစ်လှည့် နားထောင်နိုင်ပါတယ်။ ဒေတာကို collect, analyze, report လုပ်သည့် process များသည် business objectives အပေါ် တကယ်ရရှိလာနိုင်ပါတယ်။
- Step-by-step Logic
- Target Setting: Reportတစ်ခုကို clear objectives & target questions တစ်ခုချင်းက သတ်မှတ်ပါ။
- Data Source: လူသုံး CRM, ERP, web analytics tool စတာတွေနဲ့ ဒီ data များကို source နောက်ခံမှာနဲ့ရှာဖို့။
- Data Collection & Cleaning: Source မှ data collectပြီး, quality တိုးဖို့ clean & regular process.
- Data Analyze: Collected data ကို statistic tool + visual tool တွေနဲ့ analyze.
- Report Design: Data insight များကို visual format တစ်ခုတည်း highlight, organize.
- Report Generate & Share: Right format ကို တည်မြှုပ်နိုင်ပြီး, share to stakeholder နညီသညမ်း။
Special report process များသည် တတ်နိုင်သမျှ update, improve လုပ်ဖို့လိုပါတယ်။ Regular feedback, review တွေထည့်သွင်းတဲ့အချိန်မှာ custom report တွေအနေနဲ့ business need တွေနဲ့ always fit လုပ်အောင်ဖြစ်လာနိုင်ပါတယ်။
အသေးစိတ် အကဲဖြတ်မှ တွေးတစ်သည့် ဒေတာရွေးချယ်ခြင်း
အထူးအစီရင်ခံစာတစ်ခုတည်ဆောက်ဖို့မှာ ကိုယ်တင်း data selection process ဟာ တစ်ကယ် critical ဖြစ်ပါတယ်။ ဒီ process တစ်ခုဟာ၊ business goal အသေးစိတ်ကအမျိုးမျိုး data ကို ပြန်လည်ဆန်းစစ်စေပါတယ်။ Right data ကို collect & analysis လုပ်နိုင်စေလာ၊ strategic advantage လည်း ပိုနေ့ရိုင်။
Data collect စတင်ရင် reportတစ်ခုနဲ့ target မေးခွန်းတွေကို first step ဘဲ define လုပ်ပါ။ KPI တစ်ခုထဲကဘာတွေ follow up လုပ်ချင်လဲ? Customer satisfaction တိုးချင်တယ်ဆိုရင် customer feedbacks, complaint register, survey results များကနေ data collect ရမှာပါ။
Right data လည်း အမှန်စီ obtain လုပ်ပုံက, company internal systems တွေ, external market research, social media analysis, survey forms စသော method များအားလုံးကို strategy အဖြစ် incorporate လုပ်ပါ။ Methodology က data accuracy & trustworthiness ကိုတက်လှှမ်းစေရပါမယ်။
Data collect & analyze process မှာ data privacy და security ကိုလည်း strictly follow လုပ်လိုပါ။ အနည်းဆုံး GDPR only standard များ၊ data protection, right access management, encryption ပေါ်အသုံးပြုပါ။
Data Types
- Customer Demographic
- Sales Data
- Marketing Campaign Insight
- Website Traffic
- Social Media Engagements
- Operational Cost
Department များအတွက် data source၊ data type များကို table နှင့်တစ်လှည့် ပြထားသည်။
| Department | Data Types | Source |
|---|---|---|
| Sales | Monthly Sales Revenue, Average Revenue per Client | CRM, Finance Report |
| Marketing | Site Traffic, Conversion Rate | Google Analytics, Marketing Automation Tools |
| Customer Service | C-Sat Score, Resolution Time | Survey, Call Center Log |
| HR | Employee Turnover Rate, Training Cost | HR Management System, Performance Reviews |
Data cleaning, organizing သာမက structures မမှန်မလားလို့ analysis မှာ error ဖြစ်နိုင်တော့ လိုအပ်တဲ့ clean-up နှင့် validation processes များသင့်တာပေါ် လုပ်ပါ။
အသုံးပြုသူ ဒေတာ
User Data (customer data) များက အစားအသောက် customer profile, buying habits, site activity, app usage ဆိုတာလုံးတင်ပါတယ်။ တစ်ယောက် customer demographics (အသက်, လိင်, တည်နေရာ), behavior (purchase history, web session), attitude (preference, interest, satisfaction level) စတာတွေလည်း total insights တစ်ခု build လုပ်နိုင်ပါတယ်။
ဘဏ္ဍာရေးအသေးစိတ် ဒေတာ
Financial Data ကတော့၊ business revenue, expense, profit, loss, cash flow၊ finance health good/bad မှာ တာဝန်ရှိပါတယ်။ Regular analysis မရှိဘူးဆိုရင်, sustainable growth strategy မတည်မဖြစ်လာပါ။
Effective custom report သို့ရောက်ဖို့မှာ၊ update, accuracy, relevancy ကို feed-in ဒေတာသုံးဖို့၊ routine data improvement process သုံးဖို့ critical ဖြစ်တယ်။
အထူးအစီရင်ခံစာ တည်ဆောက်ခြင်း နည်းလမ်းများ
Custom reports တည်ဆောက်ခြင်းဟာ business needs အပေါ်ကျေနူုပ်သော knowledge/data insight တစ်ခုပေါင်းတယ်။ Standard reporting tools ကိုထက်ဆုံးလျှင် မိတ်ဆက်တဲ့ restricted features ထက်၊ targeted metric & analysis ကိုပစ်မှတ်ဆောင်နိုင်မယ်။ and data collection မှ visualization & interpretation အထိ။
ပုံမှန်မှာတော့, custom report build process ဟာ tool, data source, technical capabilities, dataset type အပေါ်အခြေခံပါတယ်။ E-commerce business အတွက် customer behaviour/analyze/metrics သုံးသလား, production company အတွက် efficiency/quality analyze/metrics သုံးသလား; method လည်း ကျွန််ားခြင်း။
- Database Query: SQL, etc. query tools ဖြင့် dataset ထုတ်ယူလို့ရပါတယ်။
- Spreadsheet: Excel, Google Sheets တို့သည် manual data organizing & analyzing tool များ ဖြစ်ပါတယ်။
- Reporting Tools: Tableau, Power BI တို့ကို visual dashboard/report တွေအနေနဲ့ အသုံးပြုနိုင်ပါတယ်။
- Custom Software Development: Report app အထူးတစ်ခုရေးဆွဲနိုင်ပါတယ်။
- API Integration: Multiple sources data များကို API ပြုလုပ်ခြင်း။
- Data Warehouse: Big data analysis အတွက် data lake မှာ store & process နိုင်ပါတယ်။
ဟောမပါနဲ့ report target audience မယ်သူများကို clear မိတ်ဆက်ထားပါ။ Key question, support decision, provide insight – these are mandatory steps. Focused report only valuable, waste data ကို avoid လုပ်ပါ။
| Method | Advantage | Limitation | Use-cases |
|---|---|---|---|
| Database Query | Direct access, flexibility | Technical specialist, time-consuming | Advanced analytics |
| Spreadsheet | Easy, accessible | Limit for big data, error-prone | Small analysis |
| Reporting Tool | Visualization, interactive reports | Cost, learning curve | Presentations, decision tools |
| Custom Software | Full customization, scalable | Expensive, develop time | Complex/unique business logic |
Data quality is essential! Wrong, outdated, incomplete data = misleading insight. Data cleaning/validation must be enforced.
အကြောင်းအရာ ဗီဇွယ်လွှာခြင်း
Data visualization သည် custom report ကို understandable/effective ဖြစ်စေပါတယ်။ Graph, table, map များသည် complex data တွေကို ပိုမိုပြည့် ဖြစ်စေပါတယ်။ Line graph, bar graph, pie chart စသည်တို့ သို့ category/period compare တွေအတွက် အခြေခံ visualization သန့်ဖြစ်ပါတယ်။
အကဲဖြတ်ရေး tool များ
Analytic tools ကတော့ custom report တိုက်ရိုက် efficiency တိုးပါတယ်။ Tableau, PowerBI, Google Analytics, etc. ဟာ data collect, clean, analyze, visualize all-in-one capabilities နဲ့ user-friendly များအနေနဲ့ ကိုယ်တိုင် support ပေးပါတယ်။ Deep insights ရဖို့ tool ကို regularly update & use လုပ်ပါ။
အထူးအစီရင်ခံစာများ၏ နှိုင်းယှဉ်နိုင်မှု
Custom report တစ်ခုသည်၊ dataset, metric, time interval, data source တတ်နိုင်သမျှ consistent ဖြစ်ရပါမယ်။ Otherwise, misleading comparison, wrong conclusion ဖြစ်နိုင်ပါတယ်။
Standard reporting framework ကို set လုပ်ပြီးနှိုင်းယှဉ်နိုင်စေပါတယ်။ Key metric, source, format define ပြုလုပ်ထားပါ။ Term definition များလည်း consistent & transparent ဖြစ်ဖို့။
- Sales Report
- Marketing Report
- Financial Report
- Operational Report
- Customer Service Report
| Criteria | Explanation | Importance |
|---|---|---|
| Time Interval | Report period | High |
| Data Sources | Where data comes from | High |
| Metrics | Key measurement | High |
| Format | Report structure | အလယ်အလတ် |
Custom report comparisons = informed decisions. Standard framework, data source, metric consistency – all essential for integrity.
လုပ်ဆောင်နည်း နှင့် သုတေသနများ
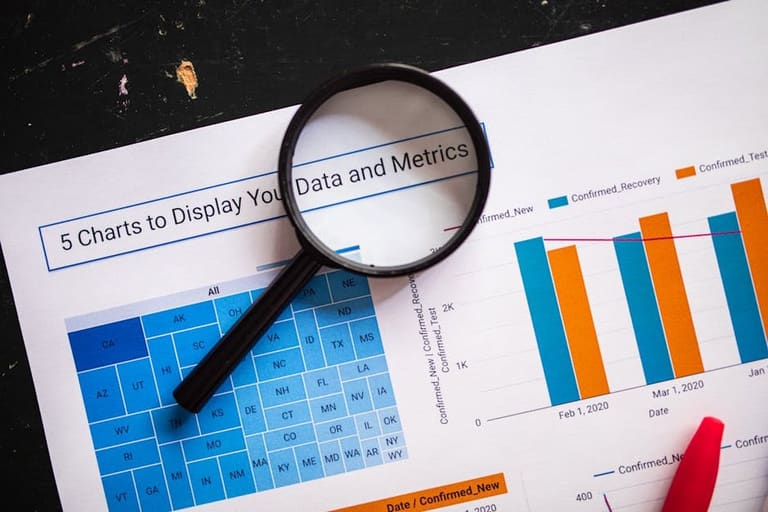
Custom report prepare လုပ်တဲ့တစ်ခုများမှာ efficiency, meaningfulness တိုးအောင် best practice, instruction, tip များပါဝင်ပါတယ်။ Report design, data collection, analysis ကတော့ process တစ်ခုစီ အရေးကြီးပါတယ်။
Data source reliability, accurate update ပြုလုပ်နည်း၊ report regularly update, review and adapt-to-market လုတ်အောင် process မှ tune-in လုပ်ပါ။ Reporting tool, software efficiency maximize ပါ။
| Instruction | Explanation | Importance |
|---|---|---|
| Define Goal | Report solves which question | Prevents irrelevant information |
| Verify Data Source | Ensure trust & accuracy | Prevent error conclusion |
| Regular Update | Report periodic revision | Stay current, relevant |
| Analyze Carefully | Right analytic method | Real results |
Tips
- Set Clear Goal
- Select Right Metrics
- Guarantee Data Quality
- Leverage Visualization
- Regular Review
- Stakeholder Collaboration
Custom report = data-driven insight, not just statistics. Careful process = better business outcome.
အထူးအစီရင်ခံစာအသုံးပြုမှု နယ်ပယ်များ
Custom reports သည် business department, division တစ်ခုစီအပေါ် targeted analysis များရနိုင်သလို, decision-making process ကို accelerate လုပ်နိုင်ပါသည်။
Deep-dive analysis, performance track, future forecast create လုပ်နိုင်တာကတော့ အထူးအစီရင်ခံစာရဲ့ သီးသန့် advantage ဖြစ်ပါတယ်။
- Sales performance deep analysis
- Customer behavior, preference detect
- Marketing campaign effectiveness measurement
- Operational efficiency analysis
- Finance performance monitoring
- Risk management, compliance audit
Each department customize-to-need စီရင်ခံစာများ generate လုပ်လို့ရပါတယ်။ Marketing – new customer acquisition, campaign measurement အတွက်; Finance – revenue/expense/balance/kpi monitoring; သီးသပ်သပ် flexibility တစ်ခုတည်းဖြစ်ပါတယ်။
| Department | Custom Report Type | Key Metrics |
|---|---|---|
| Marketing | Campaign Performance | Click Rate, Conversion Rate, Acquisition Cost |
| Sales | Sales Performance | Volume, Average Order Value, Retention Rate |
| Finance | Profitability Report | Gross Margin, Net Margin, Return on Equity |
| Operation | Efficiency Report | Production Rate, Error Rate, Resource Use |
Custom report advantages = future trend forecast, strategic objective control. Retail – detect popular product, demand spike region, supply chain optimization.
ဘဏ္ဍာရေး
Finance custom report နဲ့ standard report ထပ်မစွဲ မဟုတ်ဘူး။ Project, investment decision efficiencyသည် deep impact analyze လုပ်လို့ရပါတယ်။ Risk opportunity detect အတွက် must-have tool ဖြစ်ပါတယ်။
ဈေးကွက်ဦးတည်ချက်
Marketing custom report သည် campaign effectiveness, customer segmentation, targeted strategy achieve လုပ်နိုင်ပါသည်။ Customer value, top channel, messaging efficiency detect လုပ်တဲ့ report များကို targeted promotion အတွက် တောင့်တင်း highlight လုပ်ပါ။
Custom report = sustainable growth, competitive advantage, effective metric/analysis/usage critical for business success.
အောင်မြင်သော အထူးအစီရင်ခံစာများ၏ ထူးခြားချက်များ
Excellent custom report = strategic decision tool, operational efficiency booster. Key data, simple format, actionable advice is essence.
Success = right data, right presentation. Content must fit audience knowledge, simplify complexity. Visualization supports faster perception, summary and comparison – graphs highlight trend, table encapsulate insights.
| Feature | Description | Benefit |
|---|---|---|
| Accuracy | Error-free, updated data | Trust, avoid bad decision |
| Relevancy | Business objectives aligned | Target, avoid noise |
| Clarity | Simple, understandable content | Faster comprehension |
| Accessibility | Easy share, easy reach | Time save, collaborate |
Comparison-ready report = department, period trends detect နည်း; consistent format = future analysis easy. Actionable insight is top criteria; clear business status & suggestion for strategy is must.
- Correct & Trustworthy Data Source
- Relevant Metrics
- Good Presentation
- Timely Update
- Actionable Insight
- Comparable Data Set
Excellent custom report = decision driven, strategic advantage generator, sustainable growth supporter.
အထူးအစီရင်ခံစာများကို ဦးတည်အောင်မြင်စြာ သုံးစွဲခြင်း
Custom report successful implementation = right data, actionable insight, integrated process, feedback-based improvement, department collaboration. Regular review/update, user-friendly format, accessible visualization are vital.
Success criteria = accuracy, currency, clarity, usability. Review, feedback loops improve quality, integration, cross-team achievement. User-friendly formats (PDF, Excel, PowerPoint), visualization, multi-export options increase reach and usage.
Successful custom report builds data-driven culture. Staff access, decision support, competitive edge, continuous improvement.
- Need Analysis: Identify target business purpose.
- Data Source: Determine where required data exists.
- Report Design: Structure, format, visualization.
- Report Build: Data collection, analysis, generate.
- Validation: Test insight, confirm accuracy.
- Deployment & Training: Release, educate users.
- Feedback & Improvement: Collect comment, refine report.
Implementation Stages (Department Responsibility)
| Stage | Description | Responsible |
|---|---|---|
| Planning | Goal, objective define | Management, Analyst |
| Development | Collect data, design, test | IT, Data Science |
| Deployment | Release, train | Training, IT |
| Evaluation | Feedback, performance measure | Analyst, End-user |
နိဂုံးချုပ် & လုပ်ဆောင်နိုင်သော အုတ်မြစ်သီအိုန
Custom reports = complex dataset navigation, targeted insight generation, competitive growth, strategic achievement tool. Standard report limitation overcome, advanced analysis lead, business advantage boost.
High data quality, clean/valid data, reliable source, effective visualization are priority. Complex data must be simple/visual presentation for decision support.
| Custom Reporting Area | Key Metrics | Application Example |
|---|---|---|
| Sales Performance | Revenue, acquisition cost, order value | Top sales item, regional growth, trend detect |
| Marketing Effectiveness | Click, conversion, ROI | Best campaign, traffic channel, promotion analysis |
| Customer Satisfaction | CSat score, feedback, complaint rate | Satisfaction enhancement actions, improvement area |
| Operational Efficiency | Cost, processing time, resource usage | Process optimization, cost cutting analysis |
Continuous learning, new technology, method adoption, cross-team collaboration = better custom report infrastructure. Data share, joint analytic = better holistic insight.
- Data source audit/update
- Reporting software upgrade
- Team training
- Reporting automation
- Routine report review/improvement
- Business Intelligence tool integration
Custom report = business essential. Proper implementation enables business growth, competitive advantage, sustainable development. Infrastructure improvement is continuous, success depends on regular revamp.
မေးလေ့ရှိသော မေးခွန်းများ
Custom report များသည် Ready-made report များထက် ဘာလိုအပ်ချက်များ ဆောင်ရွက်ပေးနိုင်သလဲ?
Custom report များဟာ ဦးတည်ချက်အလိုက် business need ကို targeted respond လုပ်ပါတယ်။ Ready-made report များက overview တောင့်တည် တစ်အထွေထွေကြည့်လိုမှတ်တမ်းများပေ၊ custom report တွေက specific metric, data ကို deep analysis လုပ်နိုင်ပါတယ်။ အ့လို့ informed decision, better strategic achievement ဖြစ်ပါတယ်။
Custom report process မှာ data accuracy, reliability ဘယ်လိုသေချာရှင်းလင်းစေမလဲ?
Data source carefully select, regular quality check, standardized collection process, automation for entry error reduction, cleaning & validation enforced = reliable data.
Custom report အတွက် suitable data types ဘာတွင်ရှိသလဲ?
Business objective အပေါ်အခြေခံ metric, sales figure, csat score, campaign conversion, web traffic, operational metric သုံး; strengths/weaknesses detect, improvement area highlight လုပ်နိုင်တာတွေကို select လုပ်ပါ။
Custom report data visualization နည်းလမ်းတွေ ဘာတွေကိုသုံးသင့်သလဲ?
Bar graph for compare, line graph for trend, pie chart for ratio, scatter for relationship, map for geodata, heatmap for density analyze; visualization method = data type & report objectives depend.
Different period custom reports comparison ကို ဘယ်လို့ meaningful ဖြစ်အောင်လုပ်ကြမလဲ?
Consistent metric/source usage, normalize for seasonality/external factor, trend, regression analysis help insight detect. Comparison ready framework must be in place.
Custom report process မှာ ဘယ် principle ကို prioritize လုပ်သလဲ၊ typical mistake ဘာတွေလဲ?
Clear, measurable objective set; relevant data; comprehensible visual; regular update; common mistake = noisy data, wrong source, messy format, unreviewed report.
Custom report departmental usage example တွေအတွက်လည်း...
Marketing – campaign measure, customer behavior analysis; Sales – trend, CRM; Finance – revenue/expense, margin analysis; HR – performance, training evaluation.
Custom report successful implementation က long-term benefit ဘာတွင်ကျရောသလဲ?
Better decision-making, competitive advantage, improved efficiency, enhanced customer loyalty, optimized sales/marketing, risk management, sustainable growth all achieved!